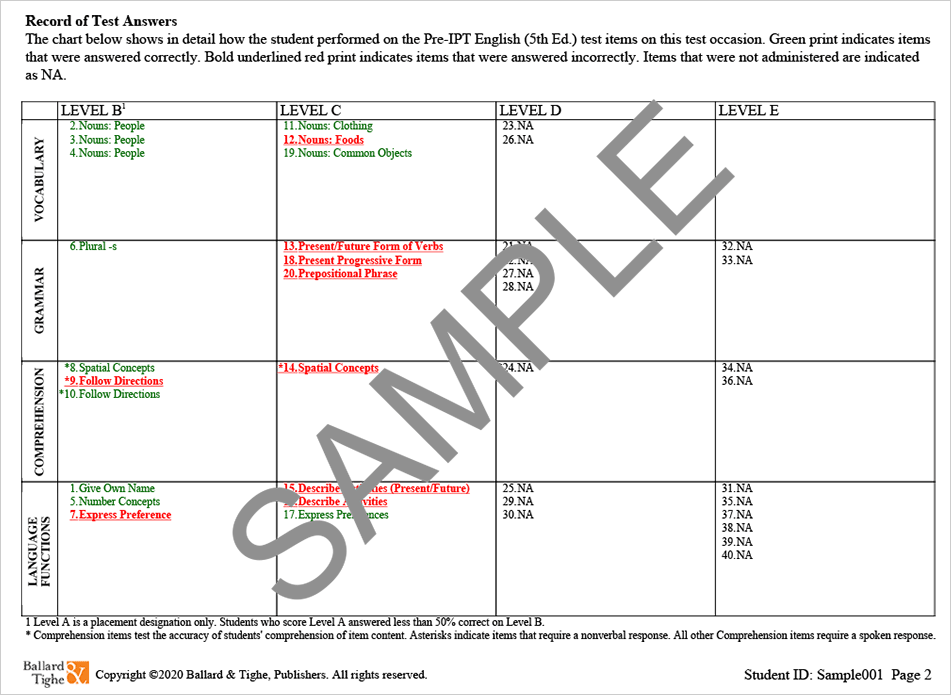
Page 2 of the diagnostic report shows a snapshot of questions that the student got correct or incorrect. The items that the student answered correctly are printed in regular print in green. The items that the student answered incorrectly are printed in red, bold underline. This provides a detailed look at the strengths and weaknesses the student showed during testing, with the test items categorized into the difficulty levels in columns, and into the main content areas assessed, in the rows.

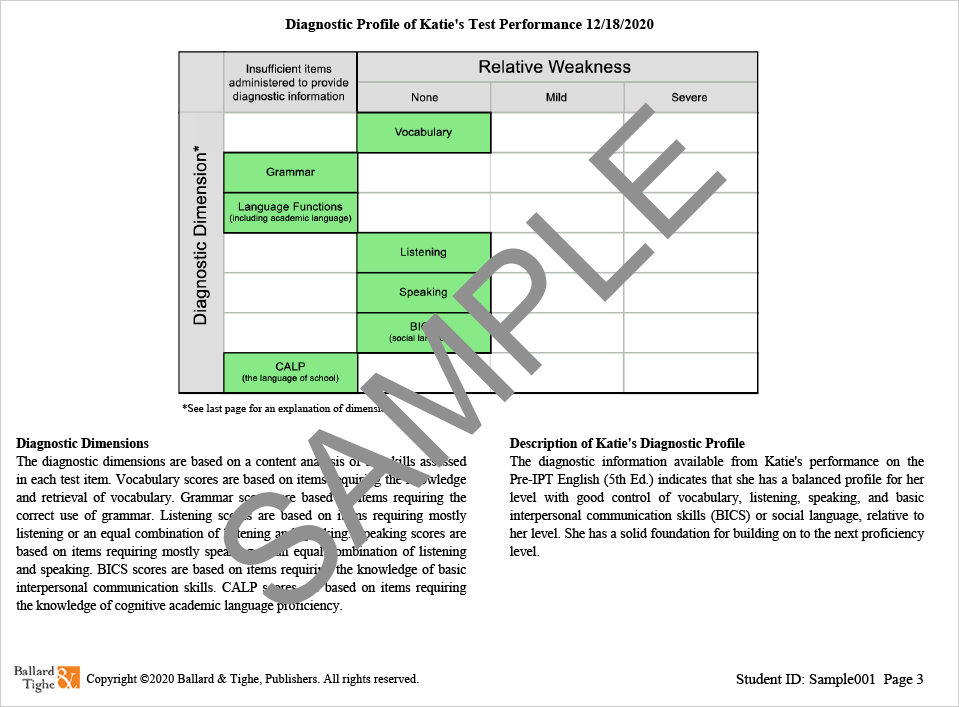
Page 3 of the diagnostic report provides a graph that shows a student’s relative weaknesses in vocabulary, grammar, language functions, comprehension, listening, speaking, and BICS compared to other students who scored at the same test level. Below the graph there is also a descriptive paragraph that summarizes the strengths and weaknesses, which begins to suggest the kind of learning that would help the student develop towards the next proficiency level.

Copyright © 2021 Ballard & Tighe, Publishers, a division of Educational Ideas, Inc.
These pages may be printed for use by course participants only.
